
Data analyst who got tired of making recommendations no one could use. So I learned to build them myself.
Four years at Deloitte and GlobalData analyzing business problems. Then I taught myself UI/UX and web dev to actually solve them.
Everything below, including this site; I built from scratch.
Keep scrolling if you want to see what happens when data meets a point of view.
Resume if you need the formal version.
I find where users drop off in the data and build the research to understand why.
Four years at Deloitte and GlobalData taught me how to read a business problem in numbers. My MBA taught me how to build strategy around it. And somewhere along the way I realised the most interesting question wasn't "what does the data say?", it was "why do people do what they do?"
Most recently: I ran an independent mixed-methods study on why learners abandon online courses, found that the learning decision is an identity decision in disguise, and designed a product concept for LinkedIn Learning built directly from that finding.
That's the loop I work in. Research → insight → something you can actually build.
SQL
Python
R Programming
Tableau
Predictive Modeling
Analytics
HTML
CSS
Wireframing
Prototyping (Figma)
JavaScript
Data Visualization
Competitive Research
User Journey Mapping
Data Extraction & Transformation
User Acceptance Testing (UAT)
Economic Analysis
Before pixels, there are patterns.
Before prototypes, there are Python scripts.
These projects are my backstage pass; where I clean the data, test the hypotheses, and find the story hiding in the spreadsheet.
Think of this as my analytical audition: proving I can speak SQL and human.
LINX for Teams — B2B Product Concept
PRD · Agile Sprint Plan · UML · Figma Prototype · B2B SaaS
Description: An enterprise extension of the LINX research: a pre-enrollment identity layer for LinkedIn Learning that gives L&D managers a diagnosis, not just data. Built to demonstrate full product analyst skills: stakeholder personas, MoSCoW prioritisation, Agile sprint planning, UML diagramming, and an interactive Figma prototype.
The Problem: Companies spend $1,254 per employee on training. Only 8% of CEOs see the business impact. The gap isn't budget - it's identity. L&D managers have completion data but no explanation for why employees abandon.
What I Built:
- PRD with personas (Monica, Ramanik, Vanya), 10 MoSCoW features, user stories, and 30/60/90 success metrics
- Product lifecycle diagram: Discovery → Define → Design → Build → Launch → Measure
- UML use case and activity diagrams for three actors: Line Manager, Employee, L&D Manager
- Agile Sprint 1 plan with epics, story points, task breakdown, and definition of done
- Interactive Figma prototype: 3 flows, 18 screens, CloudZZA fictional enterprise client
Key Design Decision: A Mandatory / Good to Have toggle on course assignment determines whether LINX activates — one UI decision that encodes the entire product philosophy.
Read the full article on Medium.
Explore the Figma Prototype · PRD
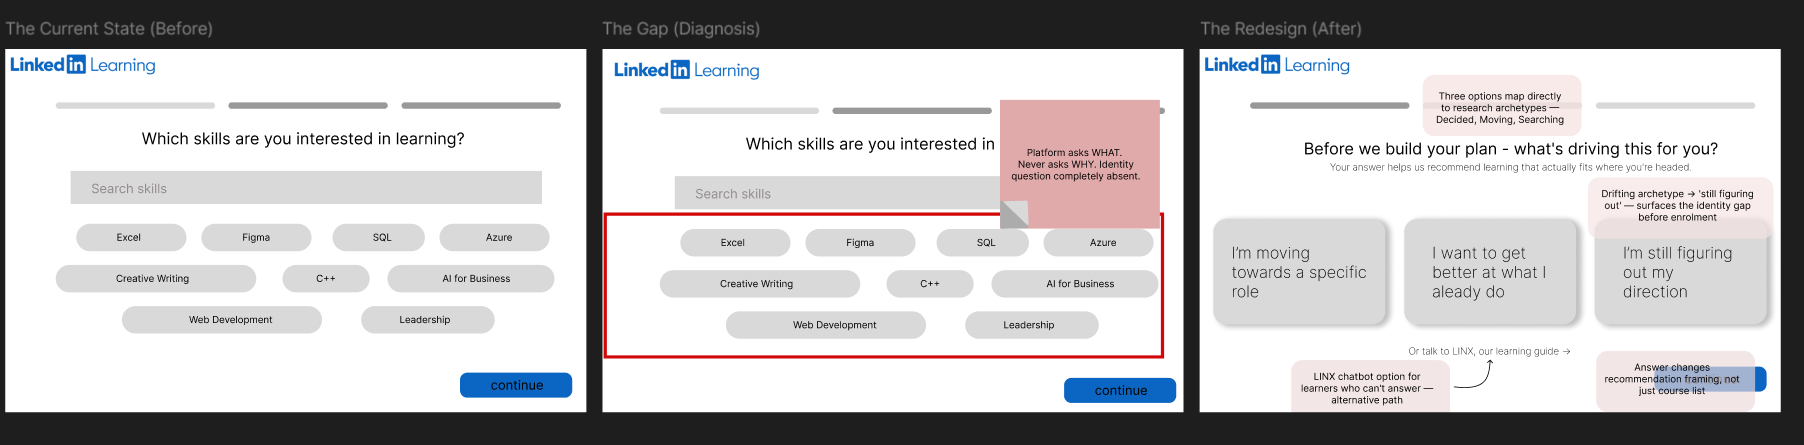
What if LinkedIn Learning asked better questions?
UX Research | Figma | Research Grounded
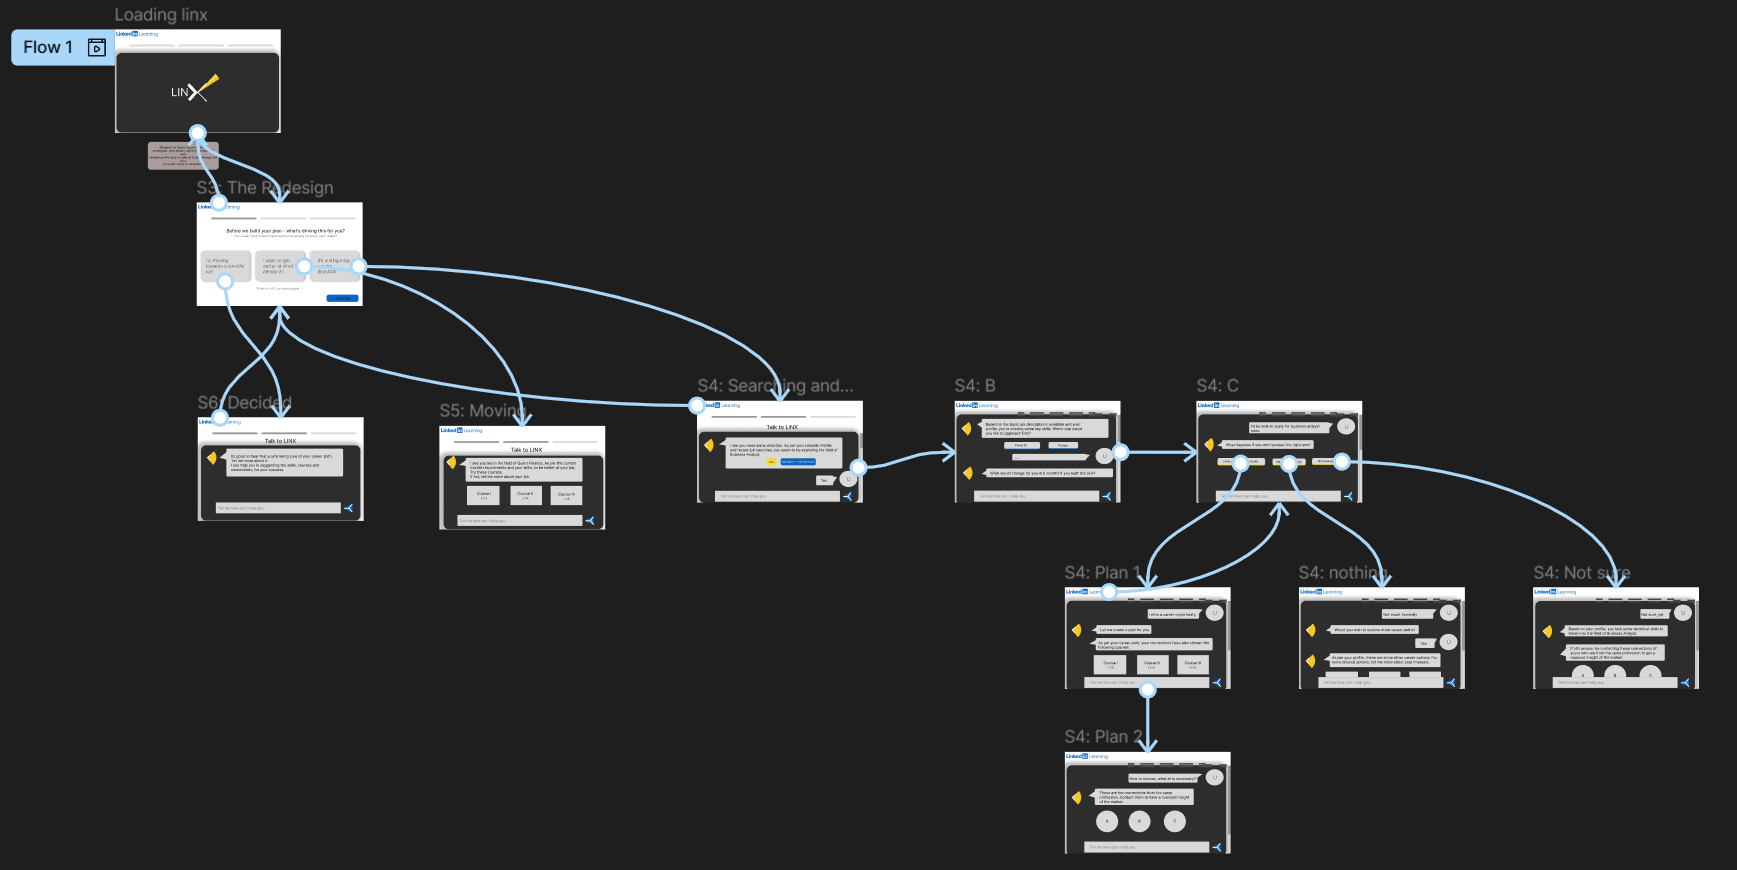
Description: A redesign of LinkedIn Learning's onboarding flow, built directly from the findings of Lost in the Learning Loop. Introduces LINX - LinkedIn's Learning and Identity Experience: a feature that asks who you're becoming before recommending what to learn.
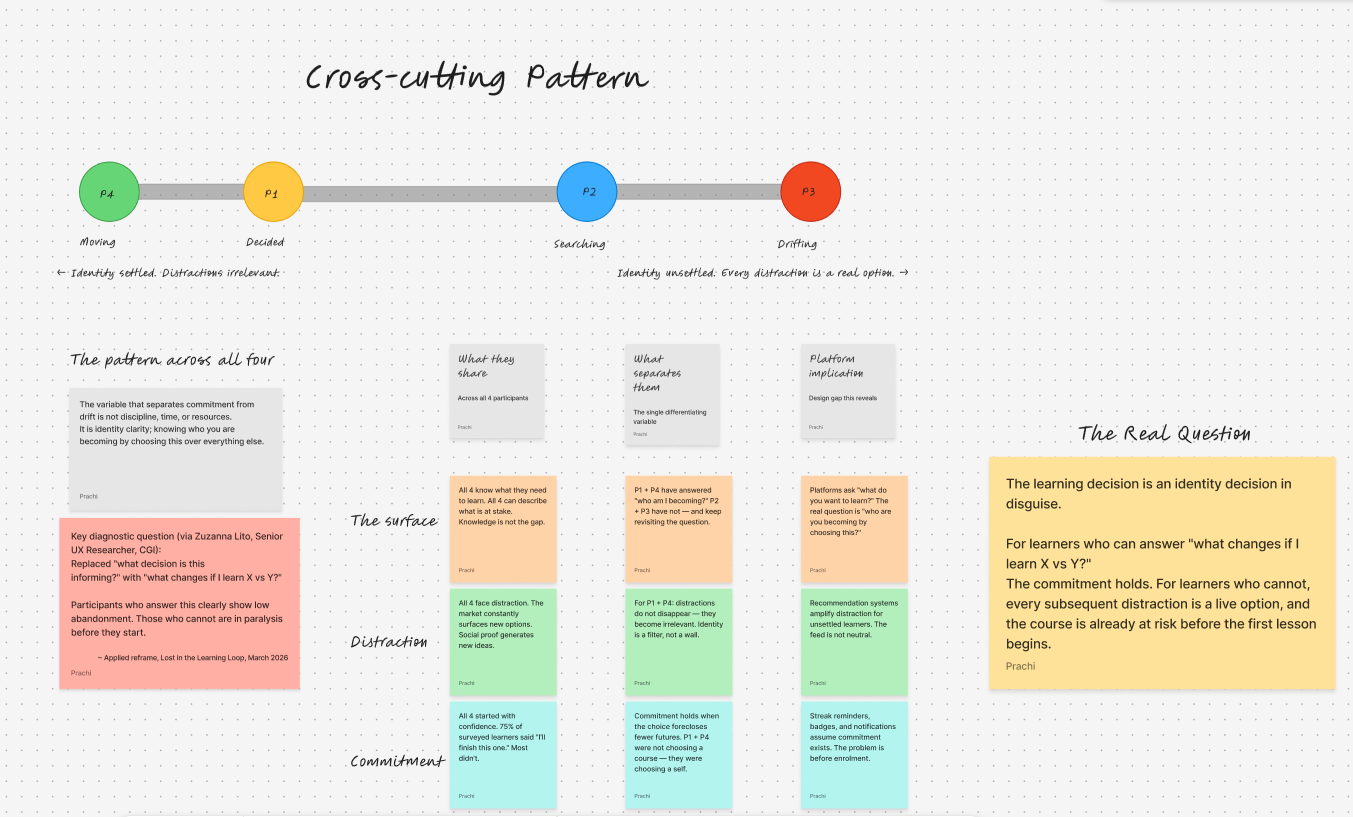
Key Findings: The learning decision is an identity decision in disguise. The variable separating commitment from drift was not discipline or time — it was clarity about who the learner was becoming.
- LinkedIn Learning's onboarding assumes the identity decision is already made; for most learners it isn't
- Three identity paths replace skill selection, each mapped to a research archetype
- LINX uses LinkedIn's existing connection graph to personalise recommendations without new data
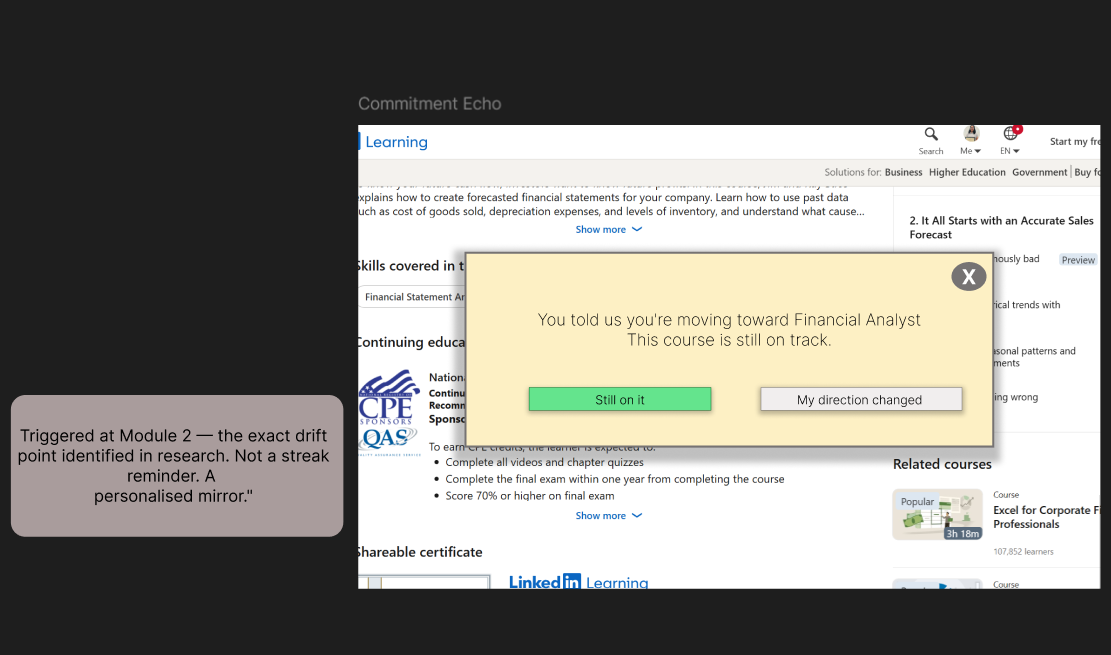
- Commitment Echo re-anchors identity commitment at Module 2, the exact drift point identified in research
Tools: UX Research, Figma Prototype, Research Grounded
Read the full case study on Medium.
Explore the Figma Prototype
Mixed-Methods Research | Survey n=20 | Interviews n=4
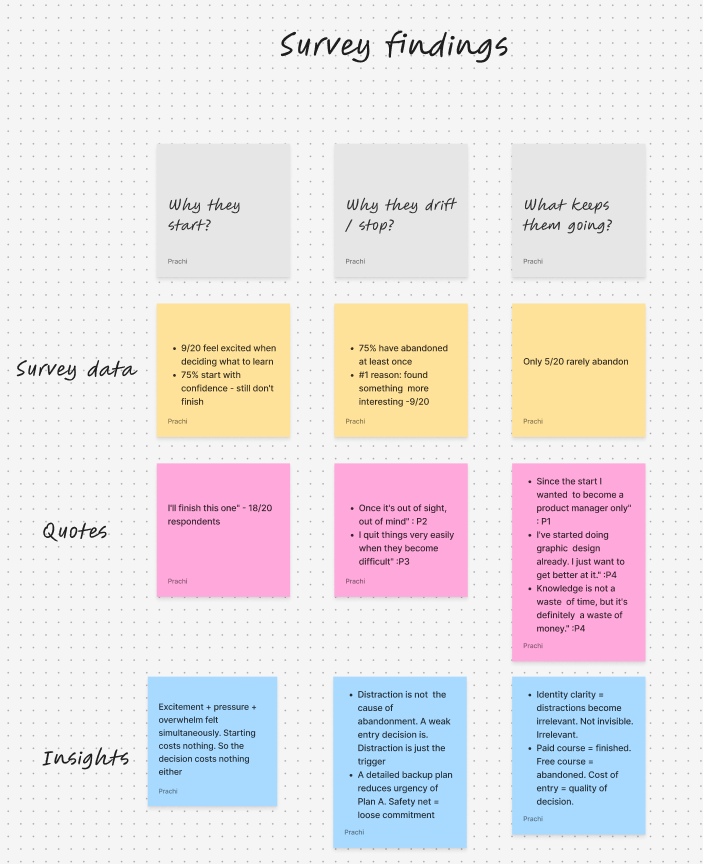
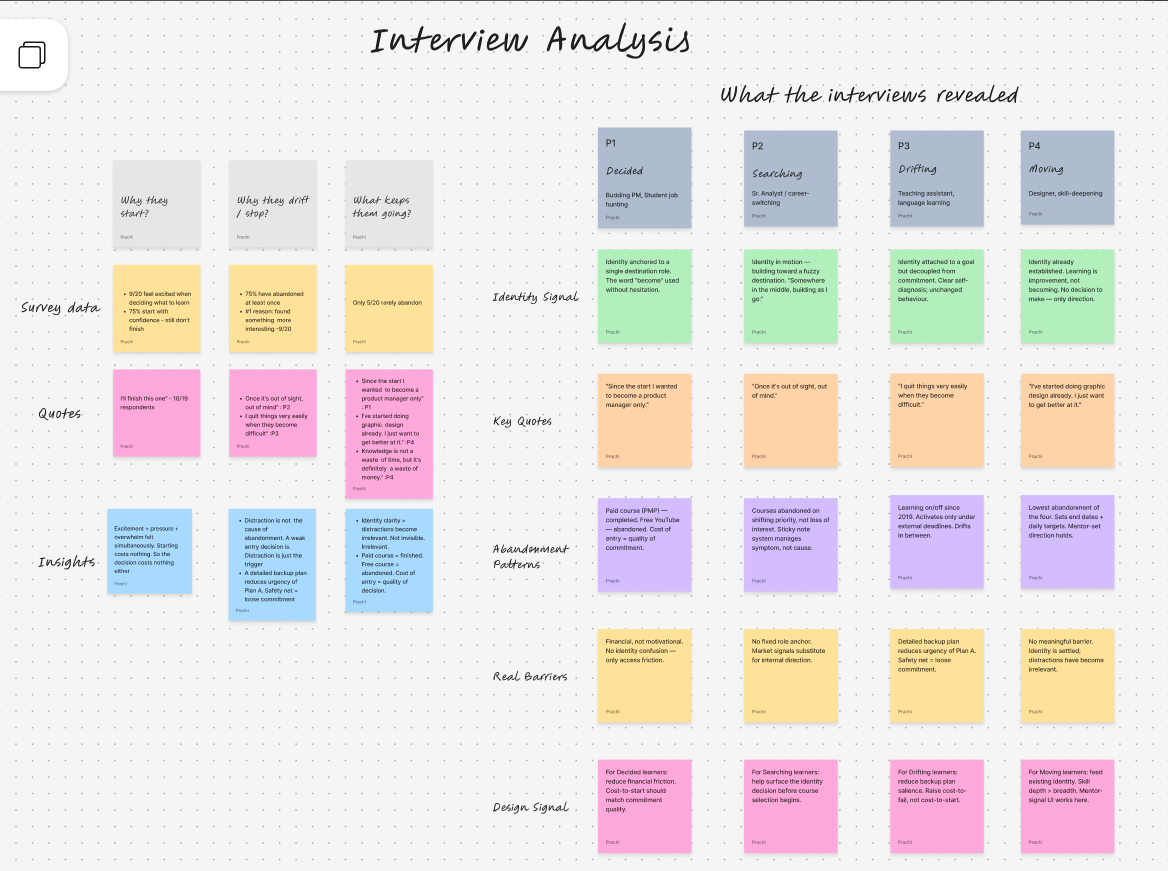
Description: How do career-driven learners decide what to study next — and why do 75% abandon what they start? An independent mixed-methods study combining a quantitative survey with four moderated interviews, conducted January–March 2026.
Key Findings: The learning decision is an identity decision in disguise. The variable separating commitment from drift was not discipline or time — it was clarity about who the learner was becoming.
- 75% of respondents abandoned at least one course — the top reason wasn't losing motivation, it was finding something more interesting
- Excitement, pressure, and overwhelm were felt simultaneously — not separately
- Four learner archetypes emerged: Decided, Searching, Drifting, and Moving
- The variable separating commitment from drift was not discipline or time — it was identity clarity
- Core finding: the learning decision is an identity decision in disguise
Design Recommendations:
- Redesign the onboarding question from "what do you want to learn?" to "who are you becoming by choosing this?"
- Treat the entry decision as a design surface, not a friction point to eliminate
- Distinguish between stuck and blocked learners — they need different interventions
Tools: Fillout (survey), Otter.ai (transcripts), FigJam (affinity mapping), mixed-methods thematic analysis
Read the full case study on Medium.
View the affinity maps on FigJam
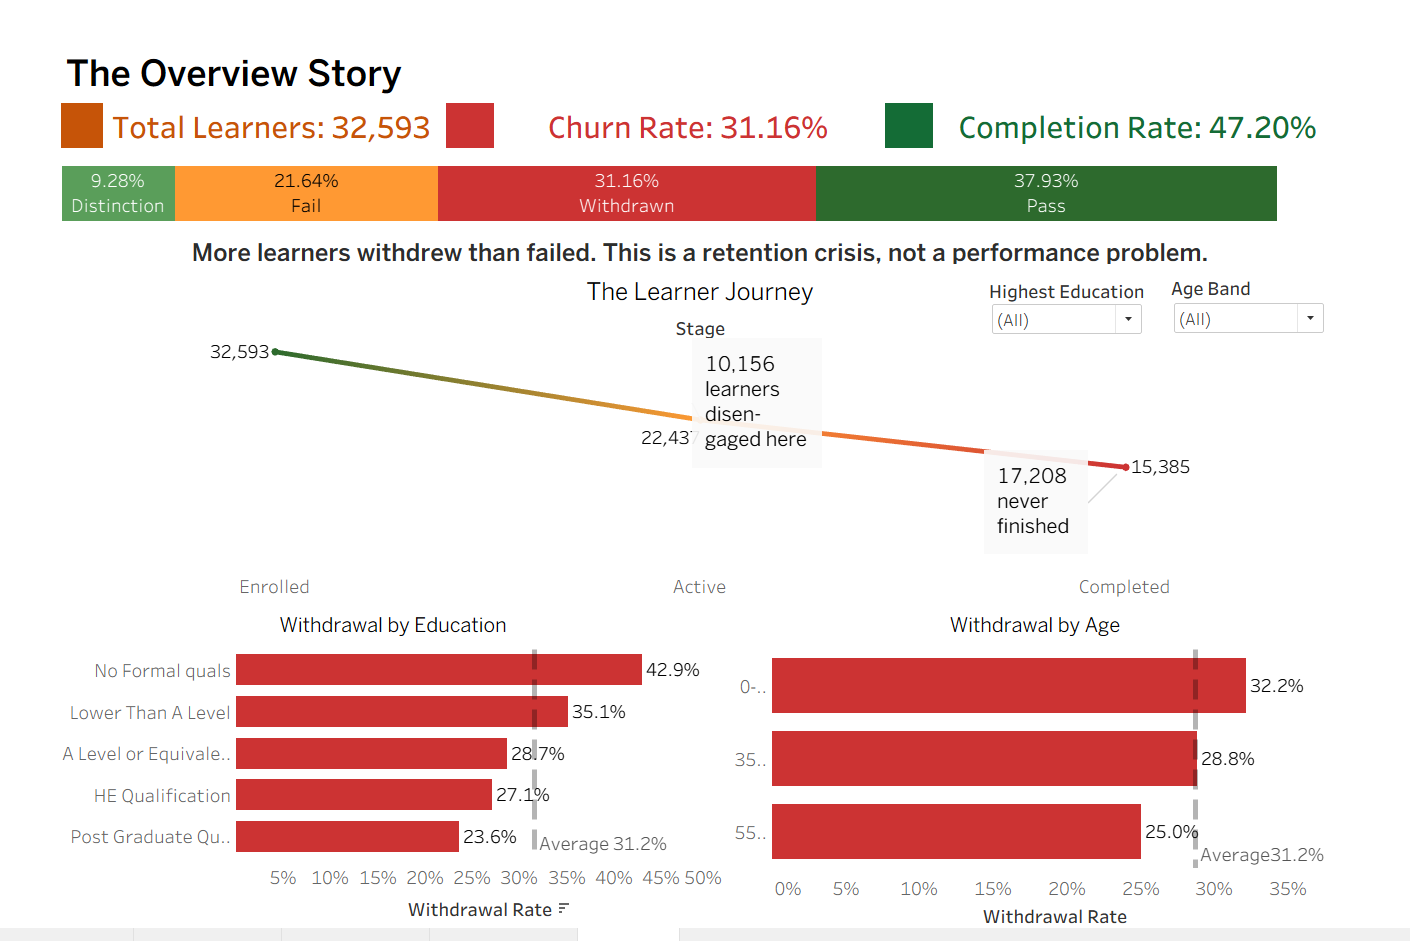
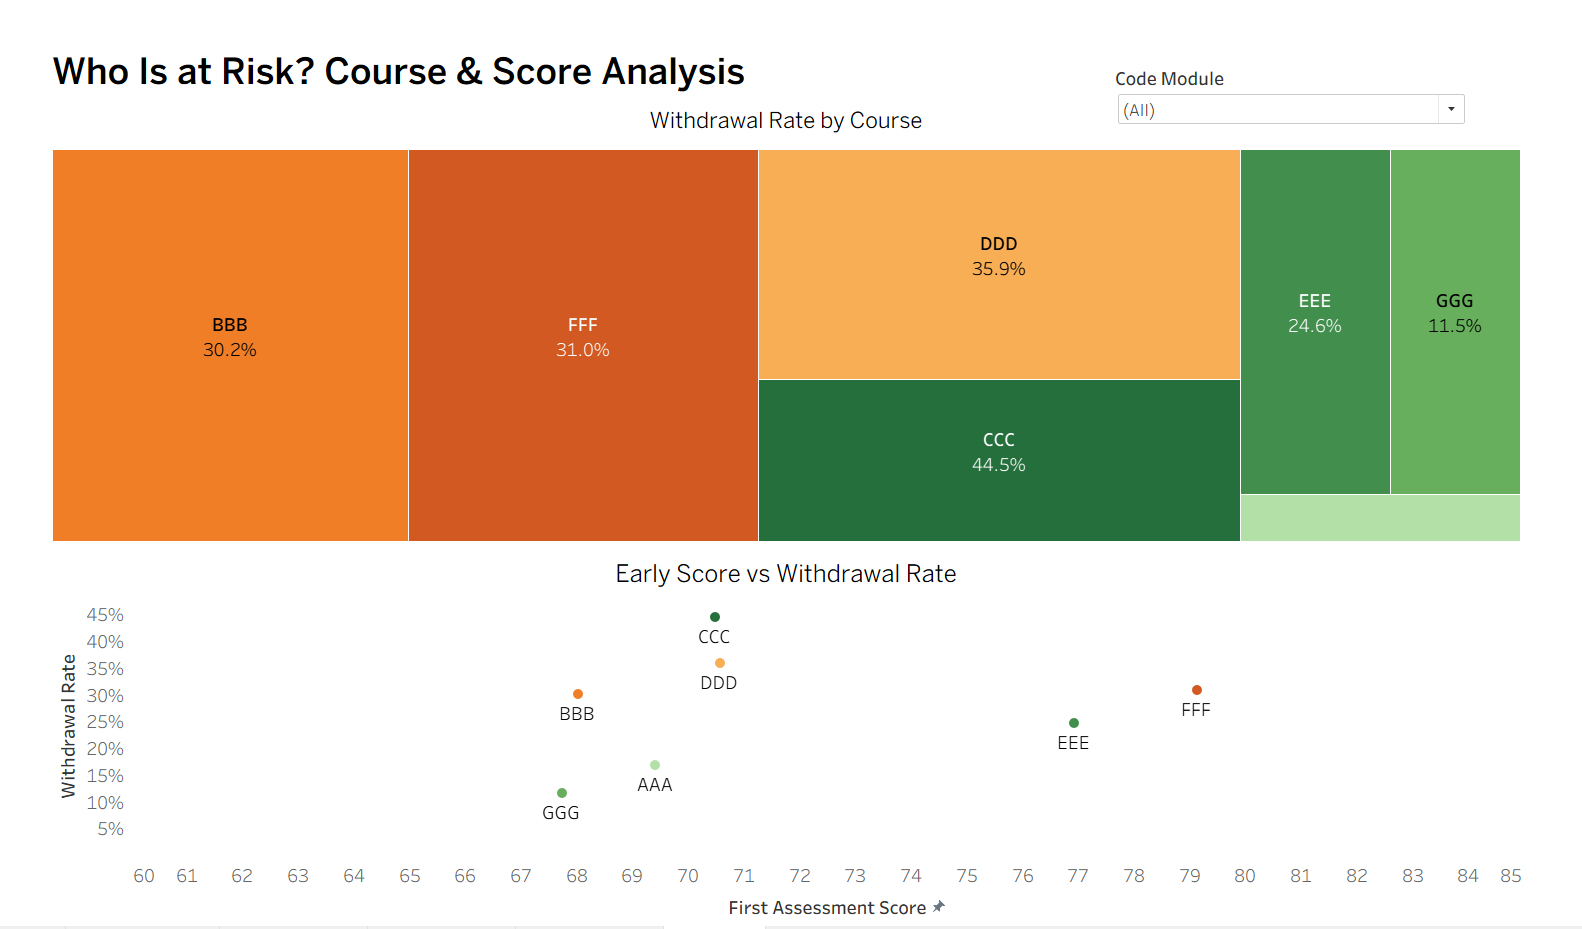
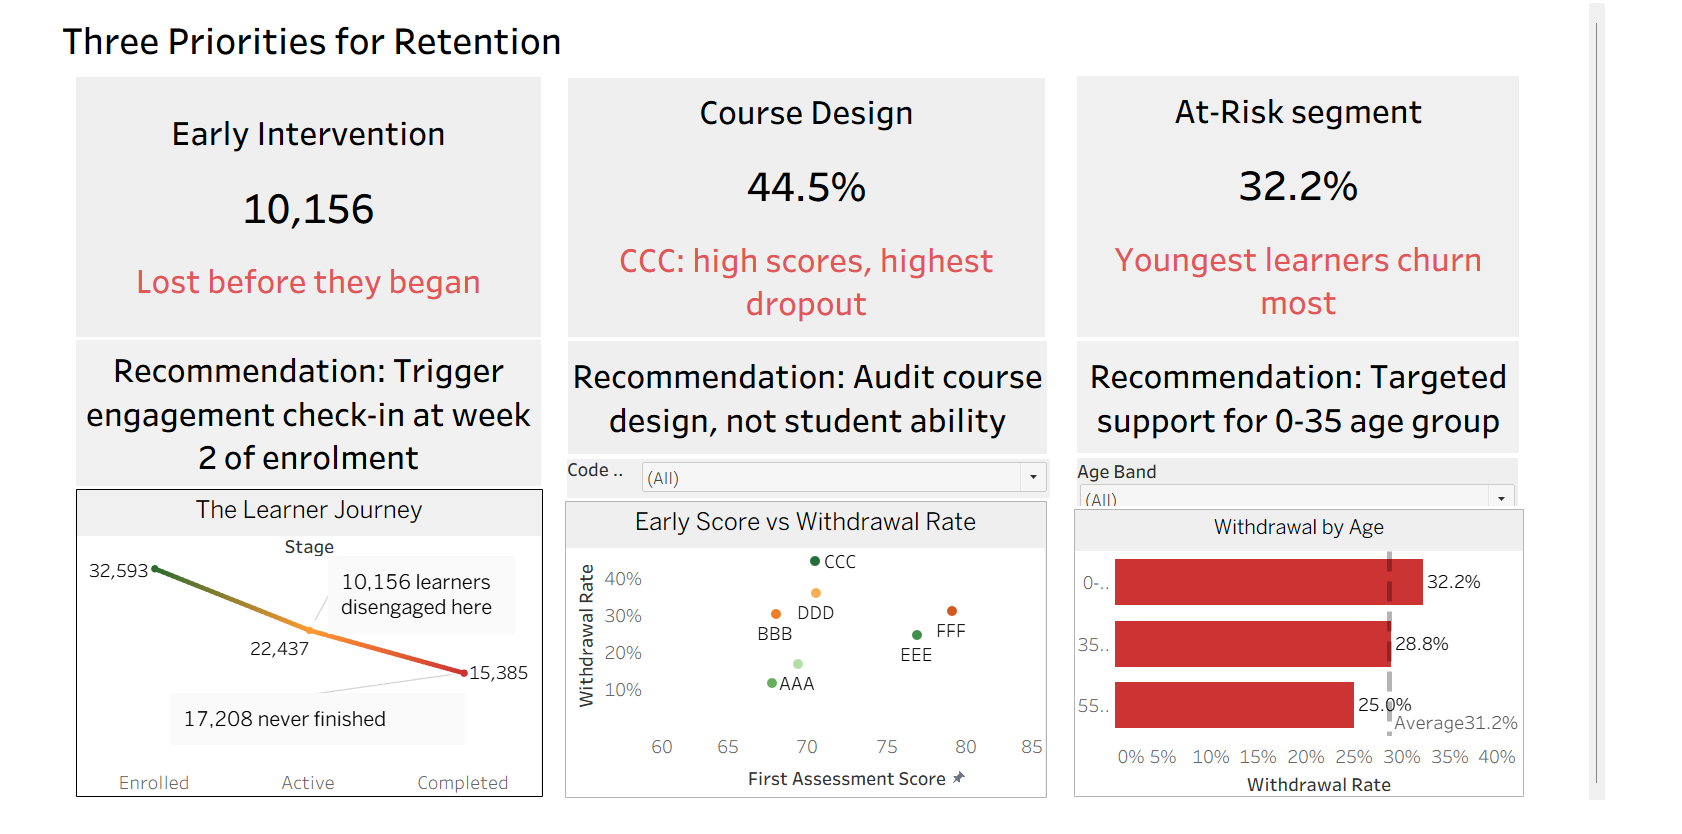
The Learner Journey: OULAD Analytics
Tableau | Python | Product Analytics
Description: Analysed 32,593 Open University learners to uncover what drives student withdrawal — and what to do about it.
Key Insights:
- 10,156 learners disengaged between enrolment and active participation
- No formal qualifications = 42.9% withdrawal rate (highest of any group)
- Youngest learners (0-35) churn at 32.2% vs 25% for 55+
- Course CCC anomaly: average scores but highest dropout; course design drives disengagement more than ability
- Early assessment score alone does not predict withdrawal (FFF outlier)
Three Priorities for Retention:
- Trigger engagement check-in at week 2 of enrolment
- Audit course design for CCC, not student ability
- Targeted support for 0-35 age group
Tools: Python, Tableau, OULAD Open Dataset (Open University)
Checkout the work at Tableau.
Language: SQL
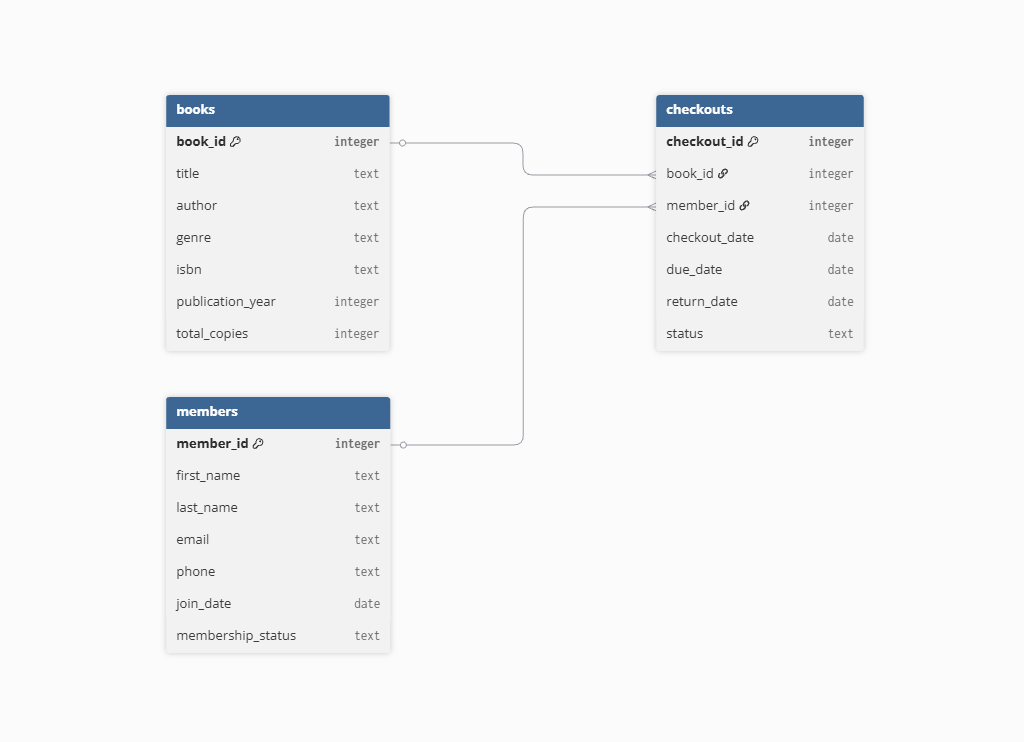
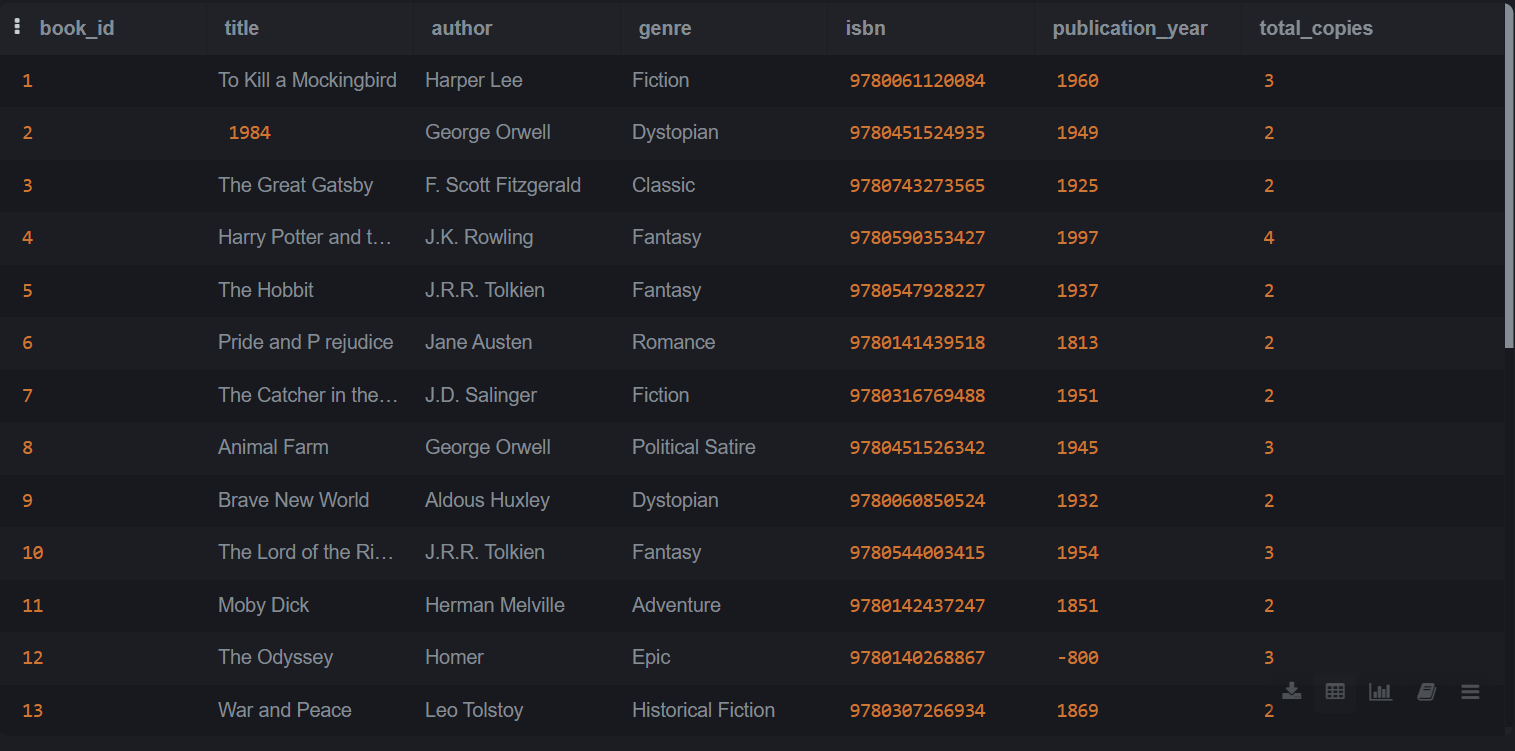
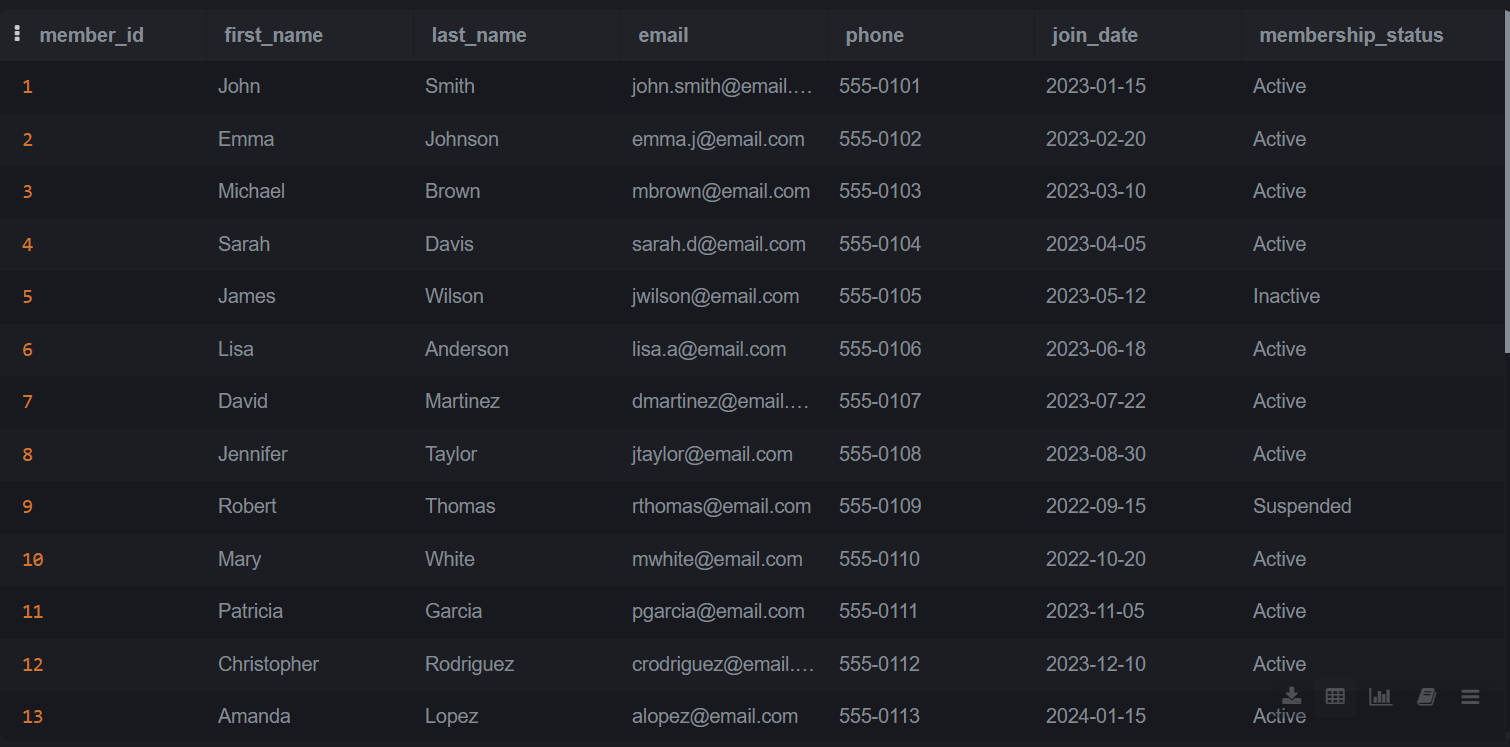
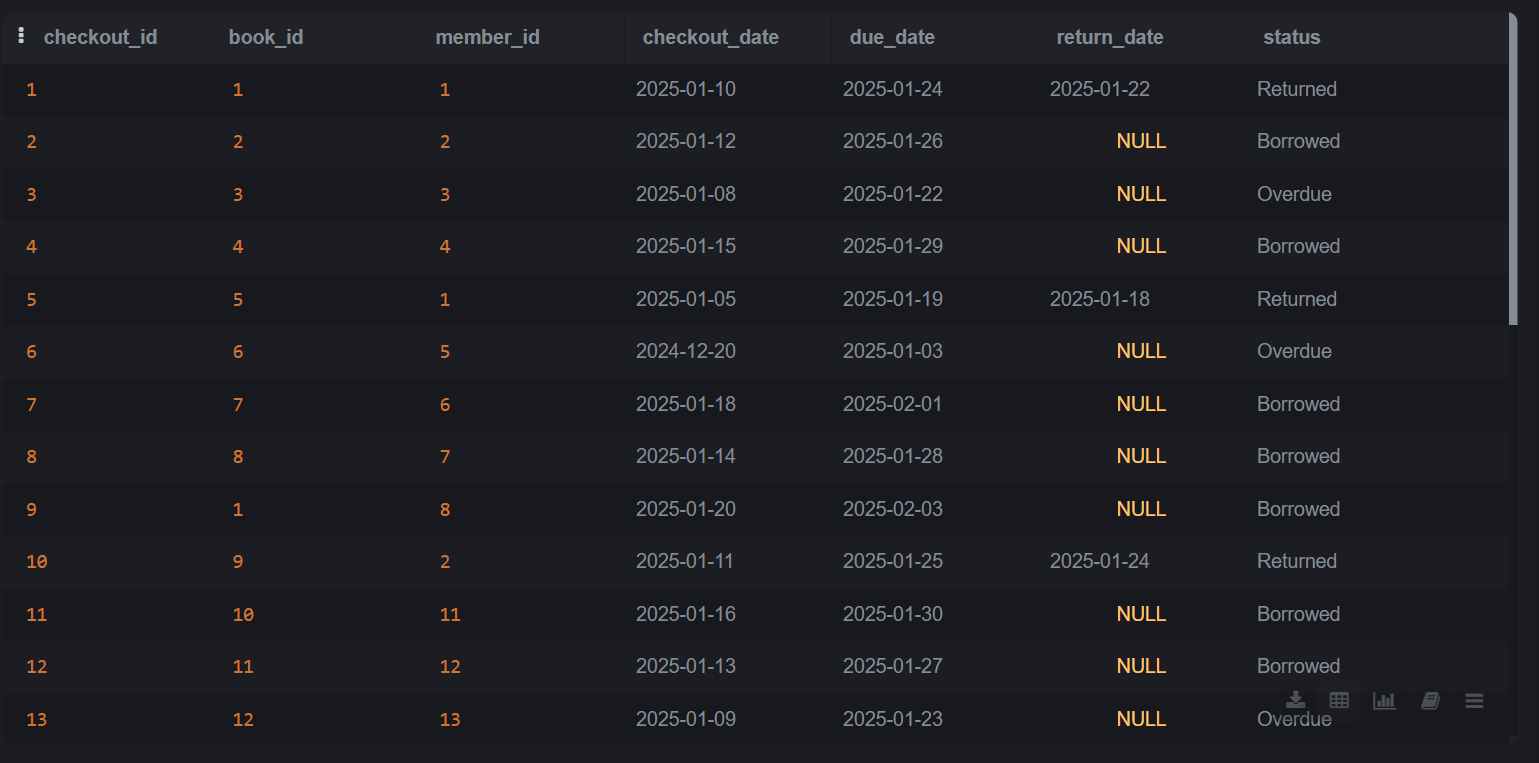
Description: A comprehensive SQL analysis project exploring library operations through data-driven insights.
Built a relational database with 3 tables (Books, Members, Checkouts) and performed 13 analytical queries to answer real-world business questions about circulation patterns, member engagement, and revenue tracking.
Key Insights:
- Analyzed 25 books and 30+ checkout transactions to identify high-demand titles and popular genres
- Calculated $45.79 in late fee revenue using CASE statements and advanced date functions
- Discovered Fantasy and Dystopian genres drive 40% of total circulation
- Identified 96% member engagement rate with only 1 active member never borrowing
- Used window functions to rank members by activity and track cumulative checkout trends
Technical Highlights:
- Complex JOINs (INNER, LEFT, OUTER) to combine data across multiple tables
- Window functions (RANK, DENSE_RANK, SUM OVER) for rankings and running totals
- Subqueries and aggregate functions (COUNT, AVG, SUM, ROUND) for calculations
- CASE statements for conditional logic in late fee calculations
- Date manipulation using julianday() to solve TEXT-to-DATE conversion challenges
Technologies: SQLite, SQL (Advanced queries), dbdiagram.io
For the complete code, visit the Git repo.
Language: Python
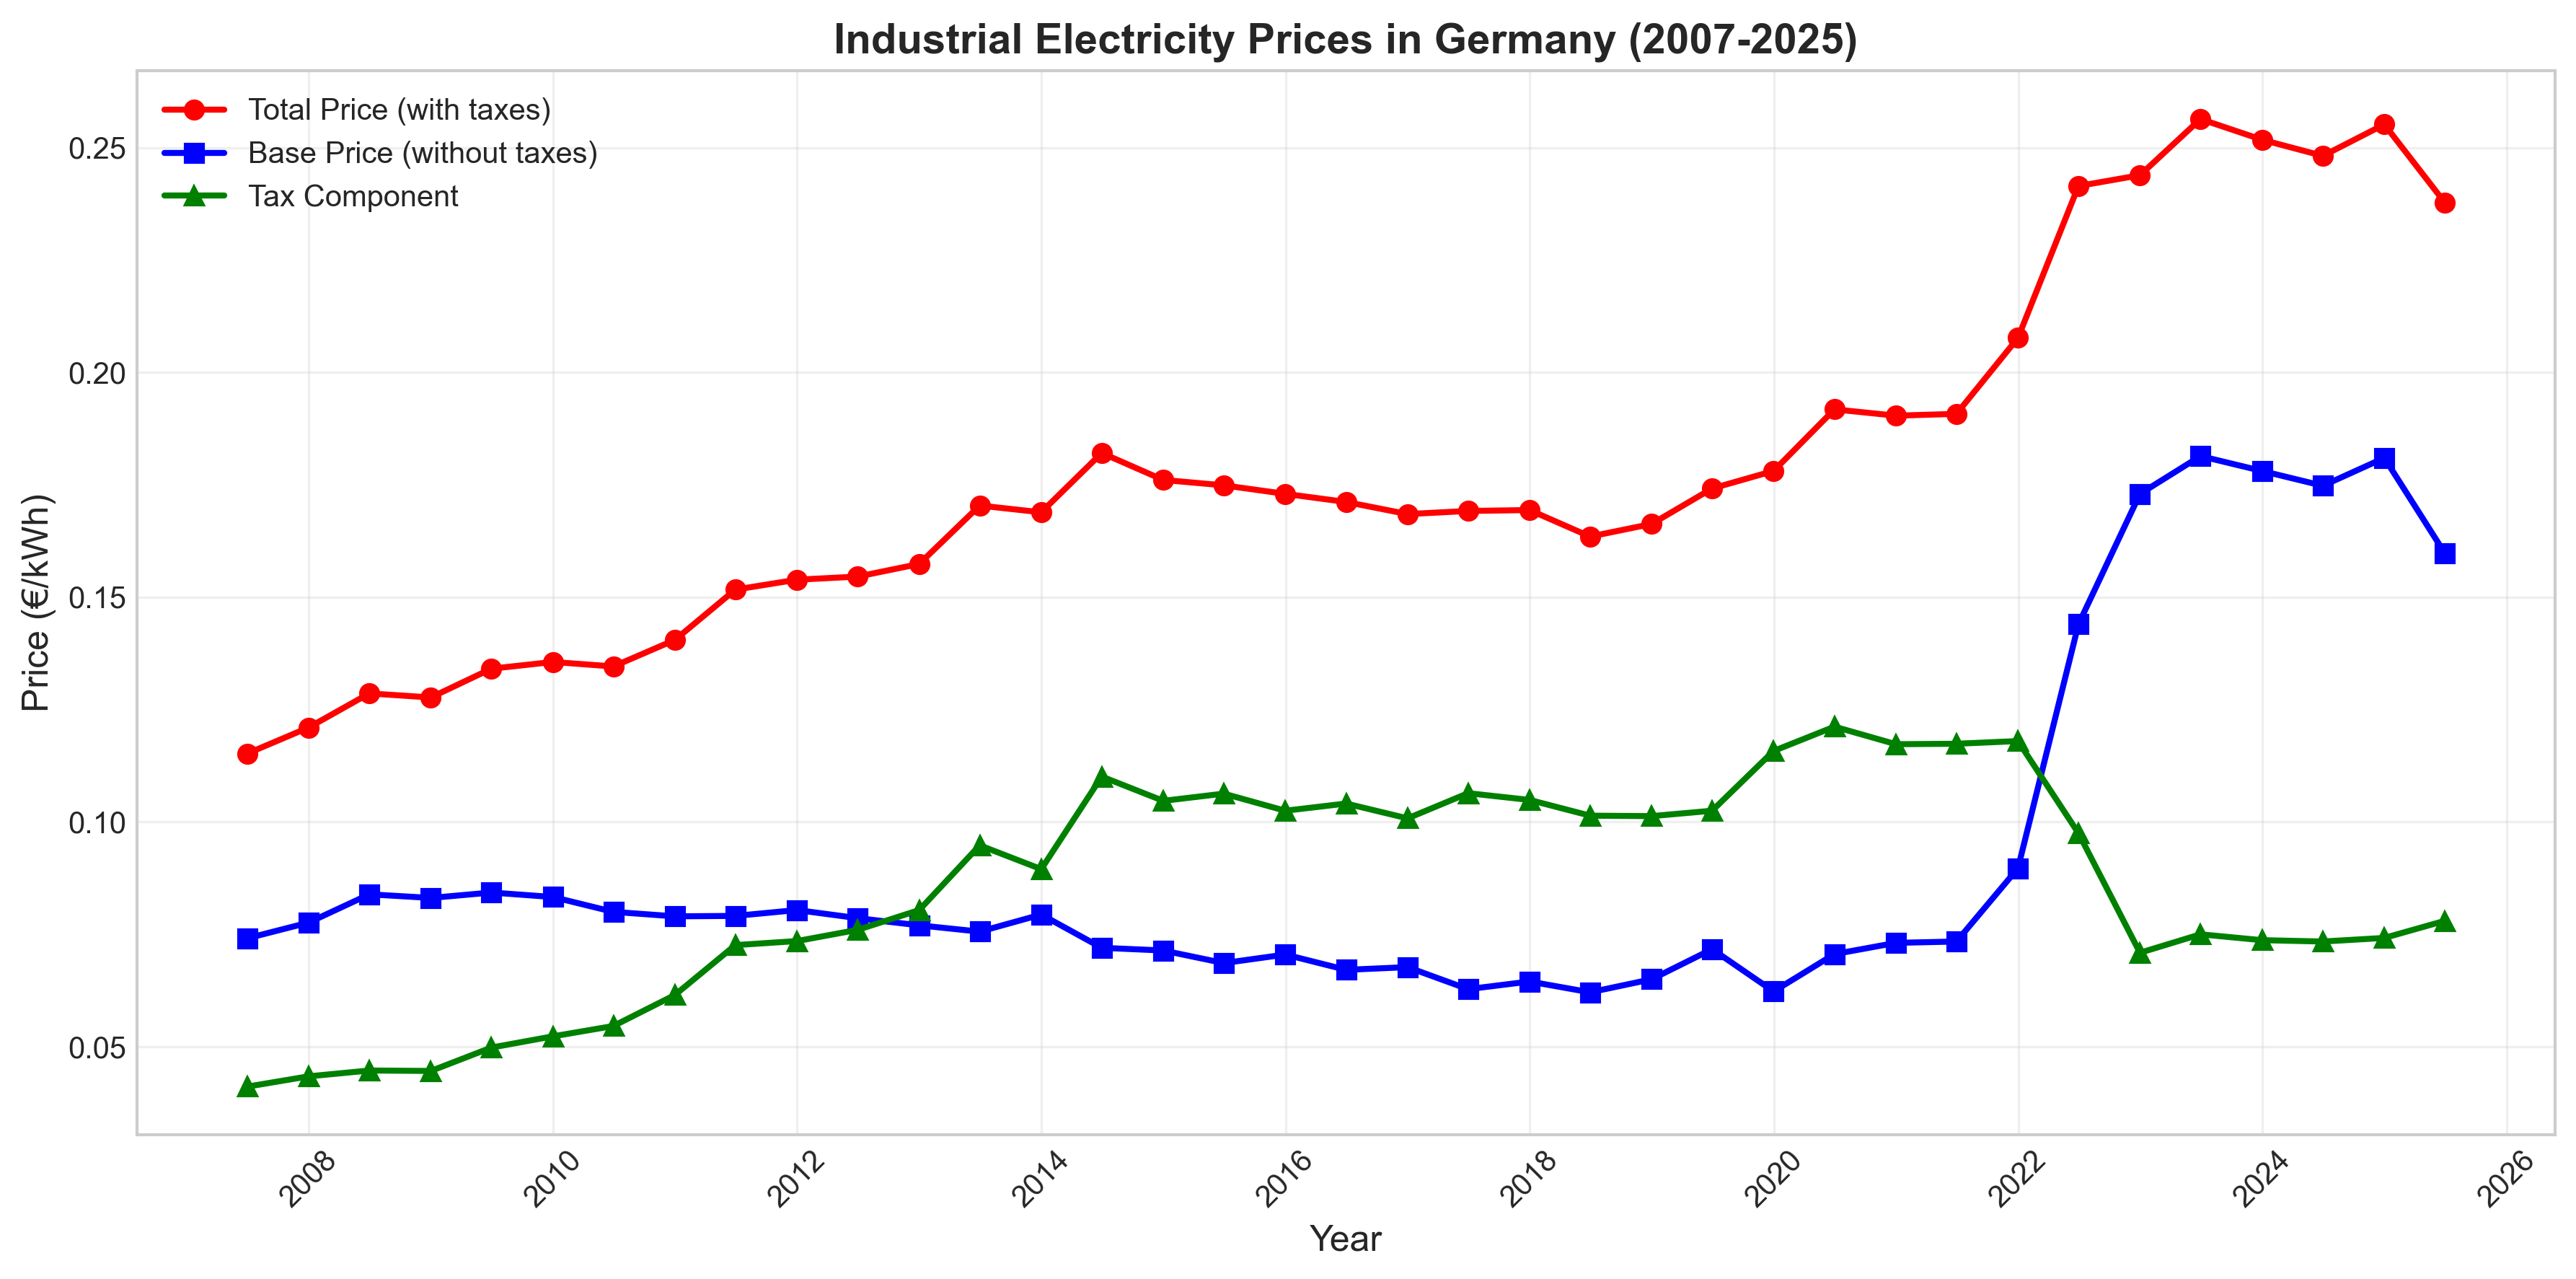
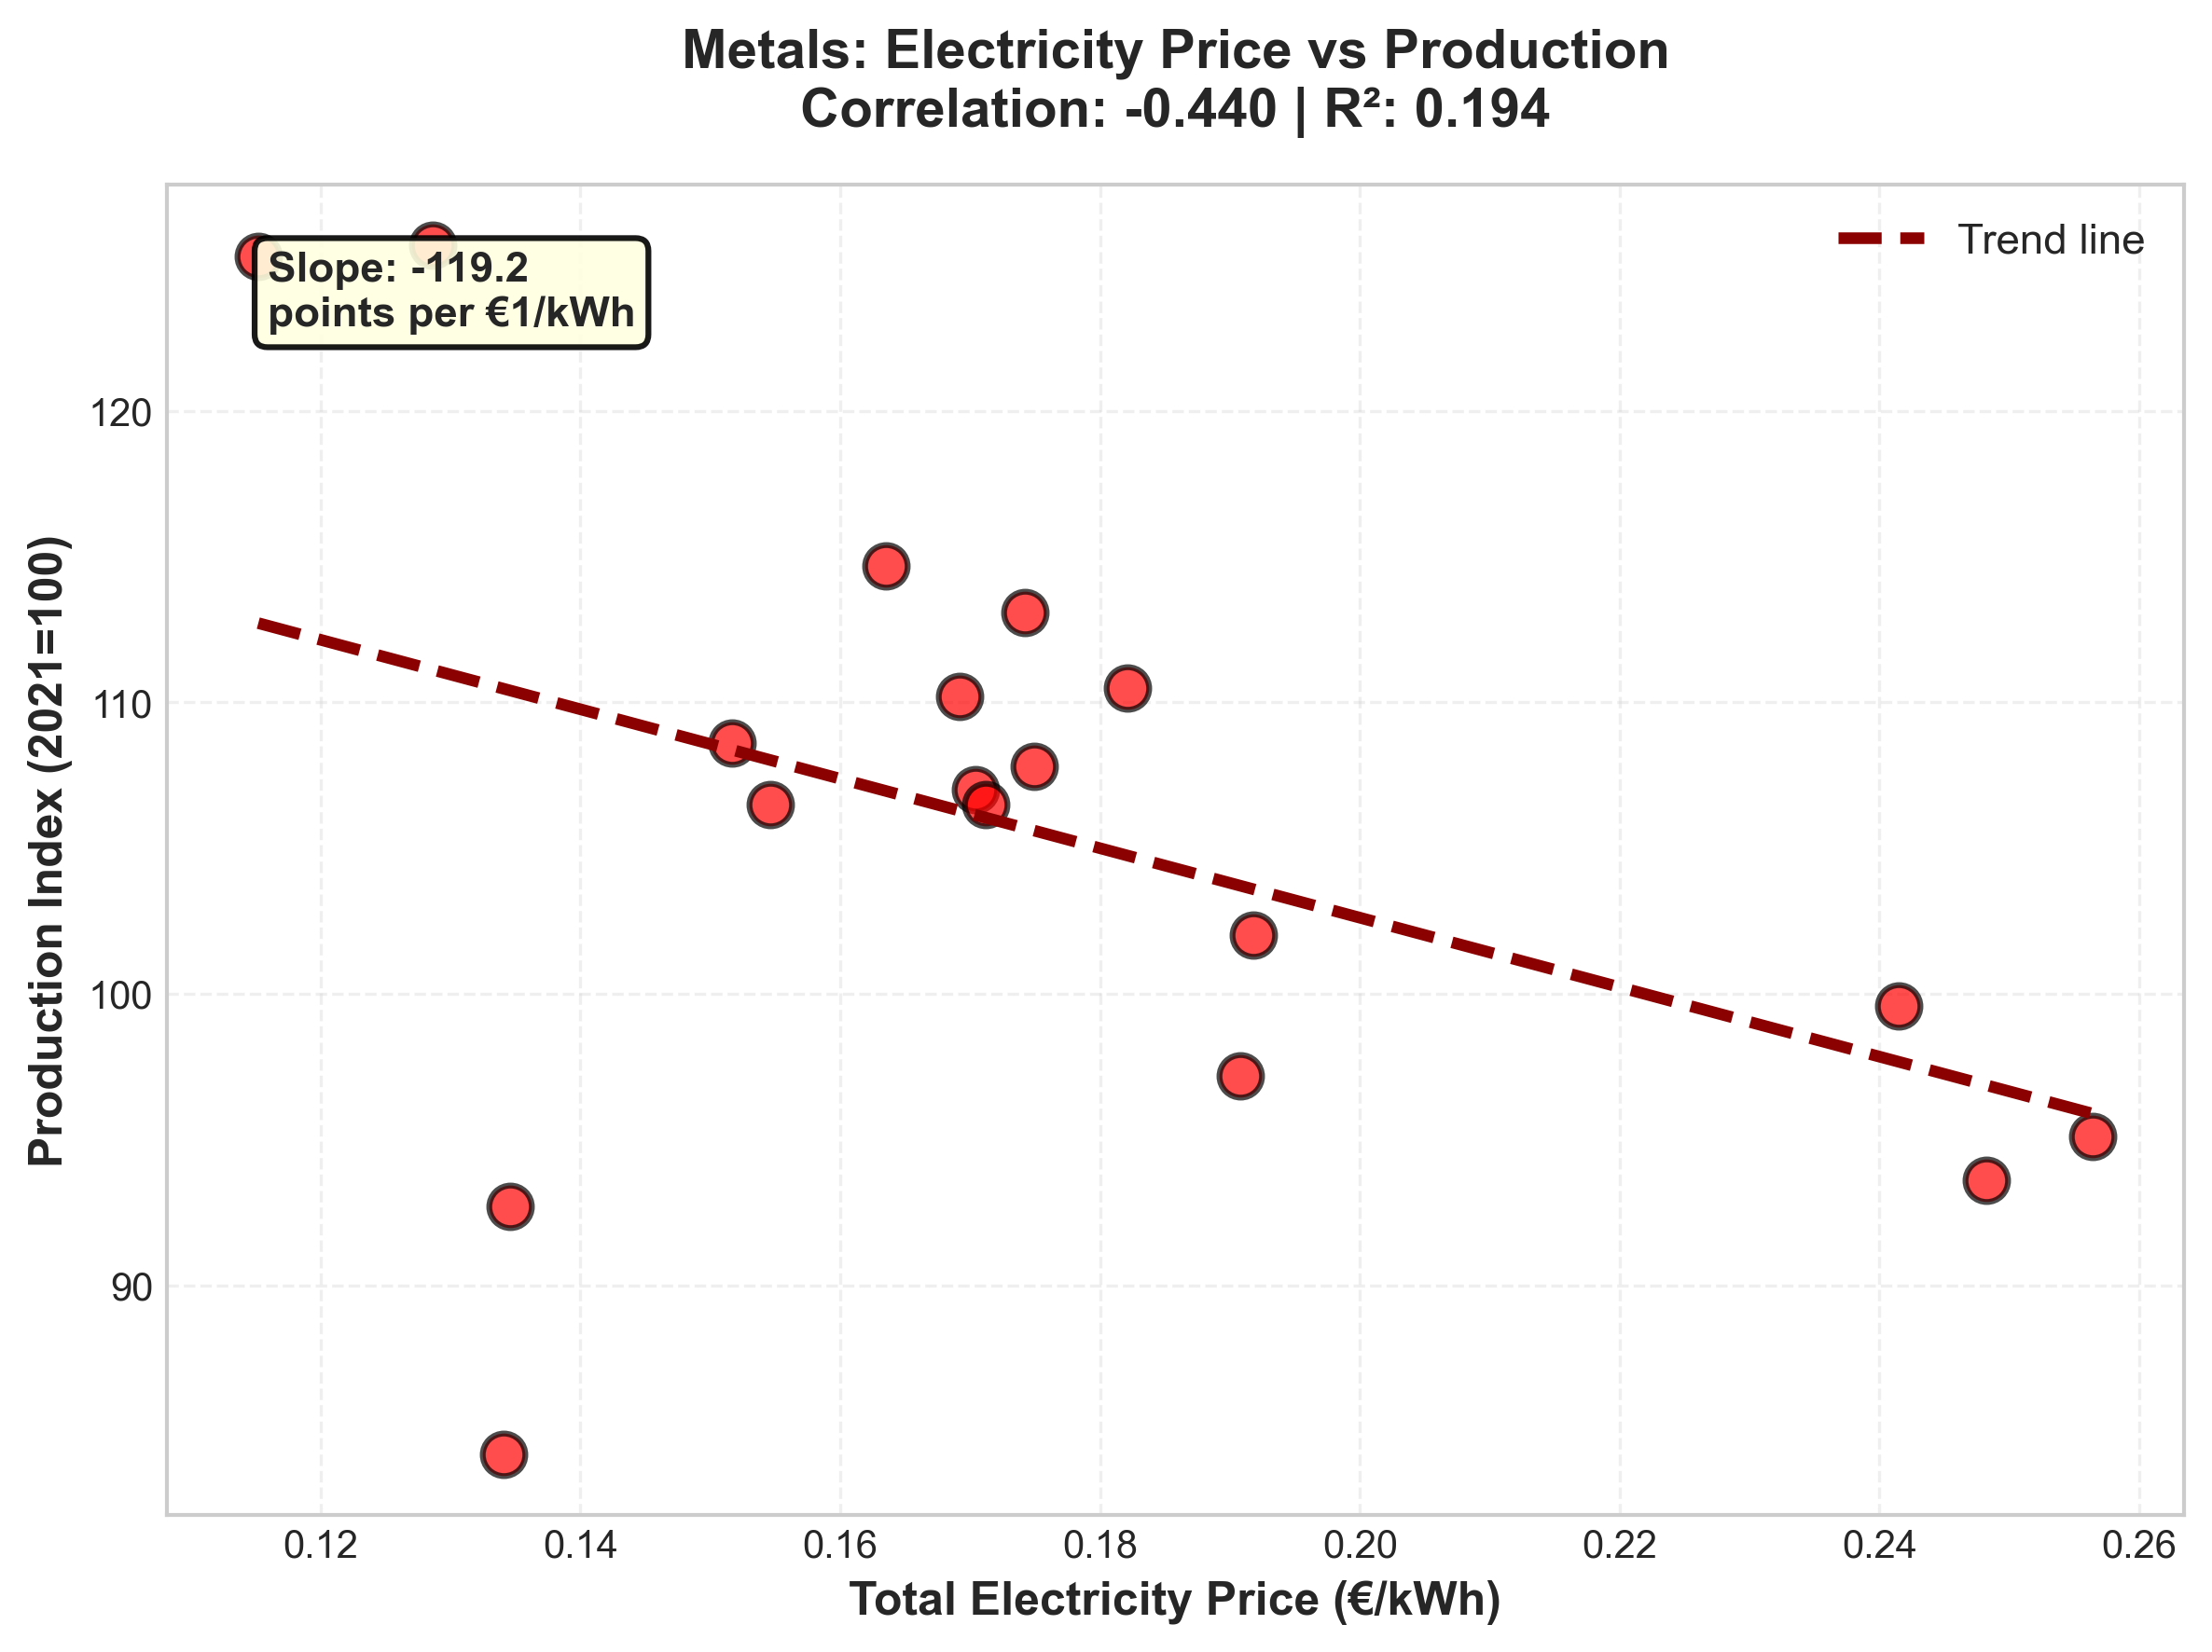
Analyzed 17 years of economic data to test whether Germany's renewable energy policy caused industrial decine.
Combined Eurostat price data with production indices across 4 energy-intensive sectors (chemicals, metals, glass, paper) to quantify the relationship between electricity costs and manufacturing output.
Key Findings:
- Industrial electricity prices doubled from €0.115/kWh to €0.231/kWh (2007-2024)
- Energy-intensive manufacturing declined by average of 22.4% across all sectors
- Regression analysis revealed electricity costs explain only 13-19% of production decline
- 2022 energy crisis (market shock) caused more damage than 15 years of policy surcharges
- Metals sector showed strongest price-production relationship (r = -0.44, R² = 0.19)
- Statistical analysis contradicts simple causation: multiple factors drive industrial decline
Technical Highlights:
- Time-series analysis with 17-year dataset (37 semi-annual periods)
- Statistical modeling: correlation analysis, linear regression, R² interpretation
- Python libraries: pandas, matplotlib, scipy, statsmodels
- Data integration from multiple sources (Eurostat, Destatis)
- Hypothesis testing with nuanced interpretation of results
Policy Implications:
Germany's experience demonstrates that energy security and price stability matter more than gradual policy-driven cost increases.
2022 crisis occurring after the EEG renewable surcharge was abolished—proves geopolitical risk management is as critical as climate policy design.
Technologies: Python, Pandas, Matplotlib, SciPy, Statsmodels, Jupyter Notebook
For the complete code, visit the Git repo.
Language: R Programming
A comprehensive machine learning project analyzing thyroid cancer risk factors using logistic regression and Random Forest models.
Built predictive models to identify key risk indicators and achieved 71.74% accuracy on balanced data.
Project Highlights:
- Analyzed 3,700+ patient records with 13 clinical and demographic variables
- Identified 3 critical risk factors: Radiation Exposure, Iodine Deficiency, and Family History (p < 2.2e-16)
- Achieved 71.74% accuracy using Random Forest with balanced dataset
- Addressed severe class imbalance using random under-sampling techniques
- Developed both binary (Benign/Malignant) and multi-class (Low/Medium/High risk) classification models
- Conducted comprehensive EDA with Chi-Square tests and visualization analysis
Technical Stack:
- R Programming (ggplot2, caret, randomForest packages)
- Statistical Analysis (Chi-Square tests, logistic regression, multinomial regression)
- Machine Learning (Random Forest, model evaluation, confusion matrices)
Critical Insights:
- Radiation exposure, iodine deficiency, and family history are strongest predictors of malignancy (p < 2.2e-16)
- Age and gender showed no significant association with cancer risk
- Class imbalance (77% benign) initially biased models toward majority class
- After balancing: Logistic Regression achieved 89.44% sensitivity with 100% specificity
- Random Forest showed 89.44% sensitivity but lower specificity (65.04%)
- Multi-class model struggled with Medium-risk category (0% sensitivity)
Built with: Tableau Public | Statistical Modeling | Strategic Analysis
For the complete code, visit the Git repo.


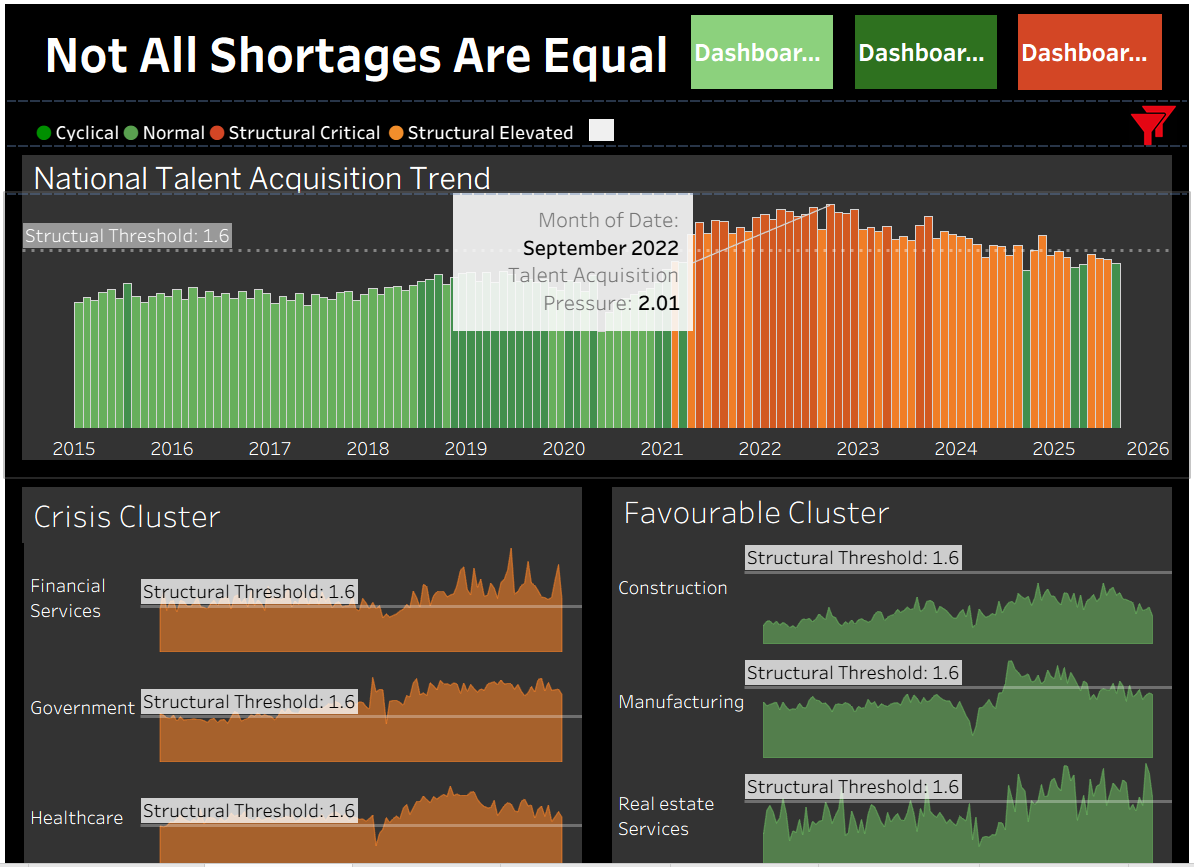
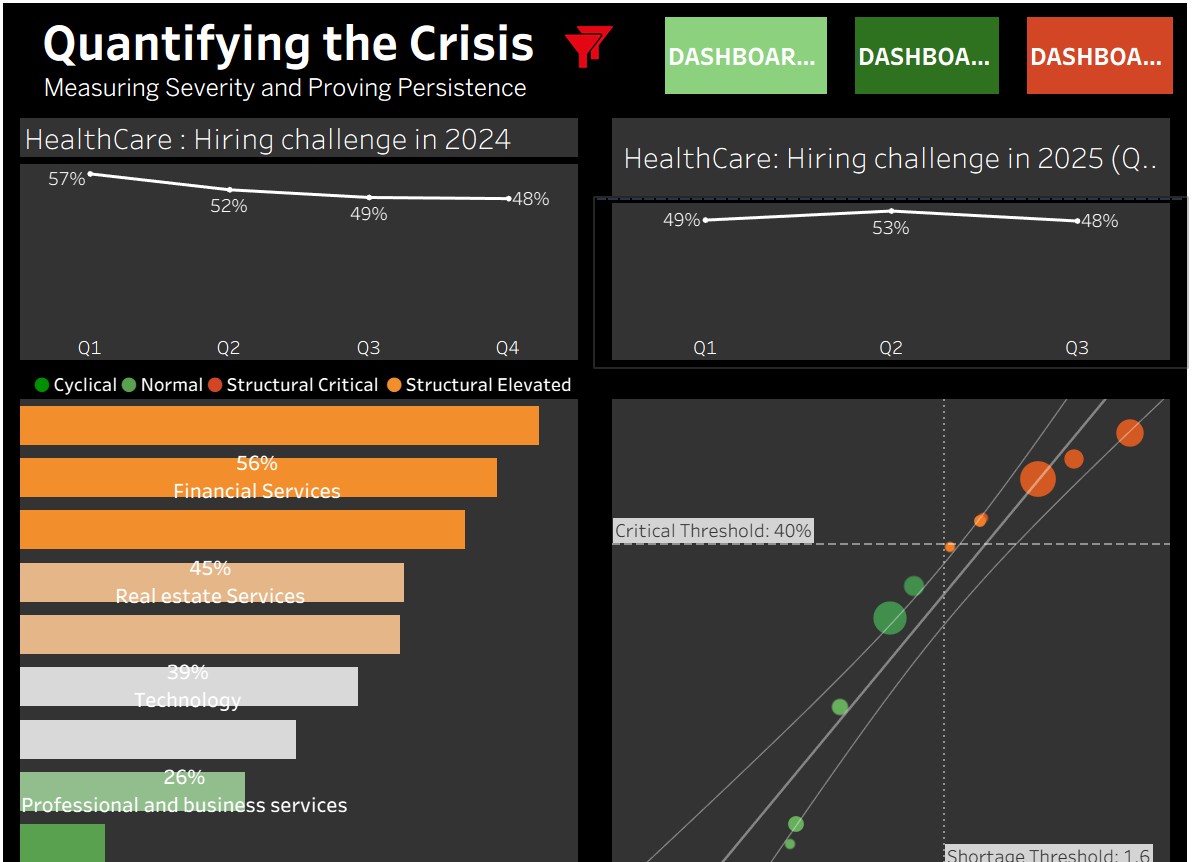
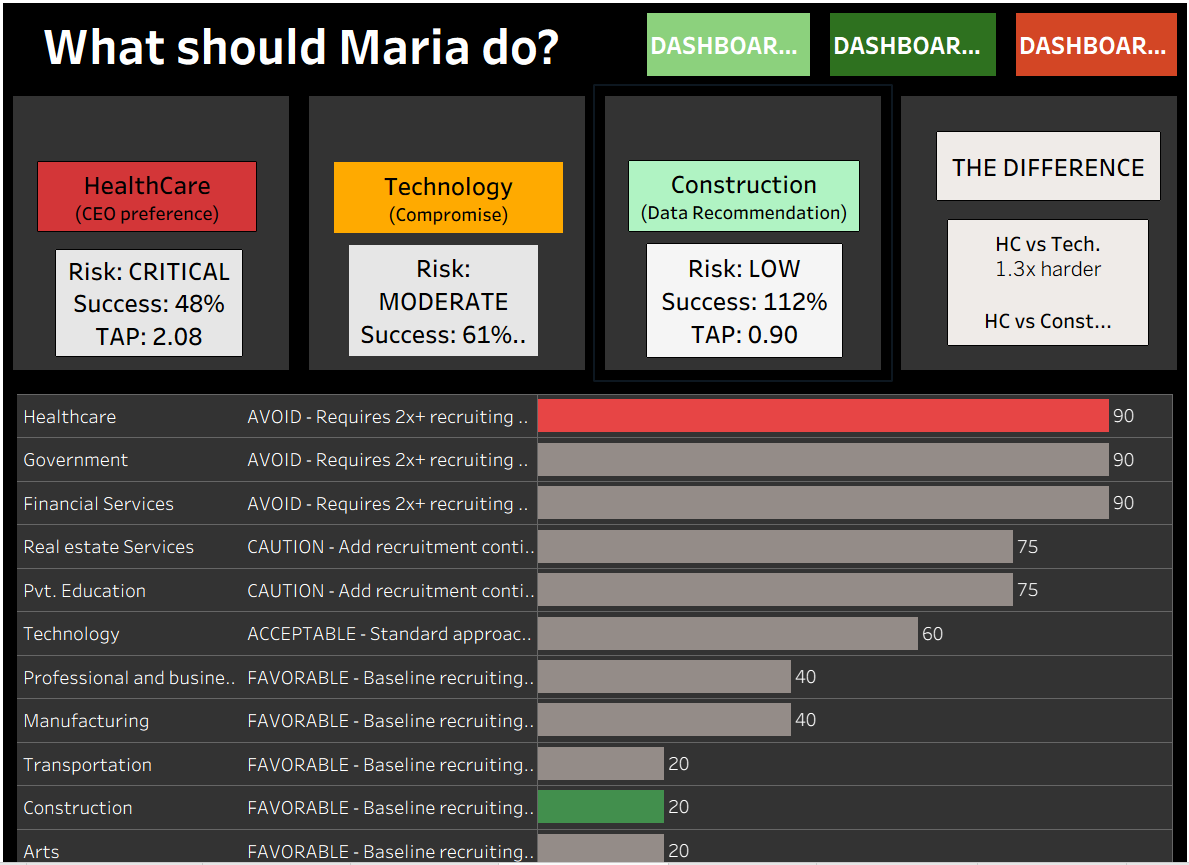
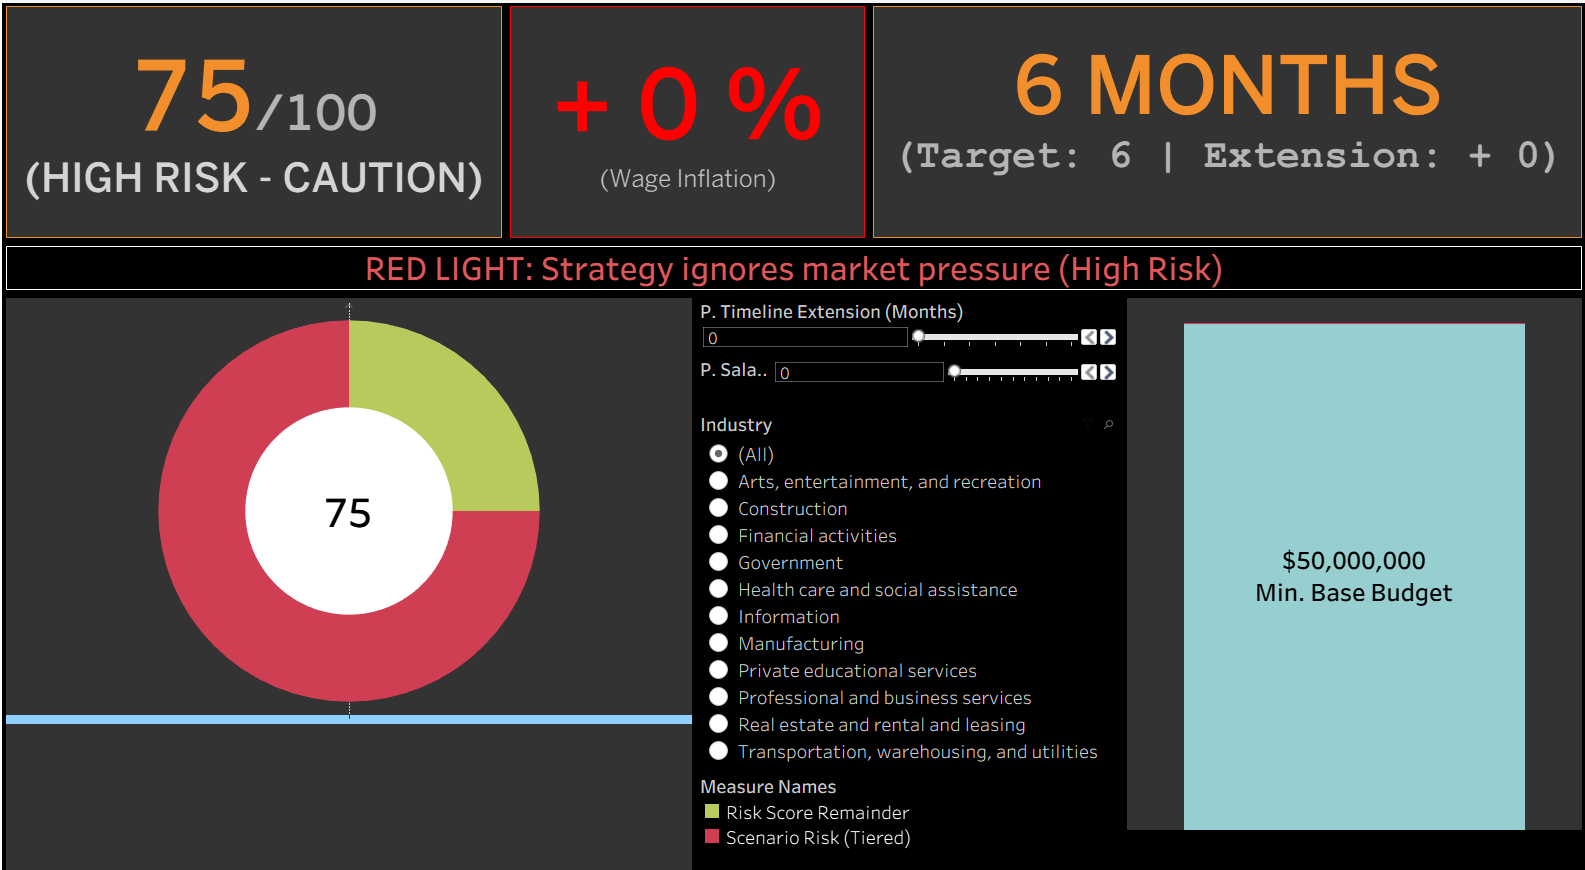
Labor Market Strategic Analysis
Software: Tableau
The $50M Question: Where Can You Actually Hire?
When a Fortune 500 CSO needed to choose between Healthcare and Construction for a major expansion, the question wasn't the market size, it was execution feasibility.
This analysis of 126 months of Bureau of Labor Statistics data revealed:
- September 2022 marked a fundamental labor market break
- Healthcare shows 52% job posting failure vs. Construction's 12%
- Three industries remain in structural shortage 35+ months later
- Hiring in Healthcare is 2.3x harder than Construction
Custom metrics developed:
- Talent Acquisition Pressure (months per hire)
- Investment Risk Score (0-100 difficulty index)
- Shortage Classification (structural vs. cyclical)
Built with: Tableau Public | Statistical Modeling | Strategic Analysis
Check out the Simulator yourself at Tableau.
I'm a true believer of 'magic by doing'.
Welcome to the creative corner.
Where analysis meets art...
Visual thinking through Illustration.
Childhood
A memory of innocent days
Father
My first hero
Jaipur
The Pink city-forever
Summer
Me time
Self-care
The late night coding sessions
Cat-man
The perfect portrait
Oscar
A loyal companion